How it works?
Data is influencing an increasing amount of our decisions.
But how do we make sure we have the data we need and how do we get the data we’re missing?
Step 1: Creating a shared understanding
Using a mix of own expertise and experience, own and available online research and Large Language Models we can establish a map of the ecosystem (market) we want to be part of and influence.
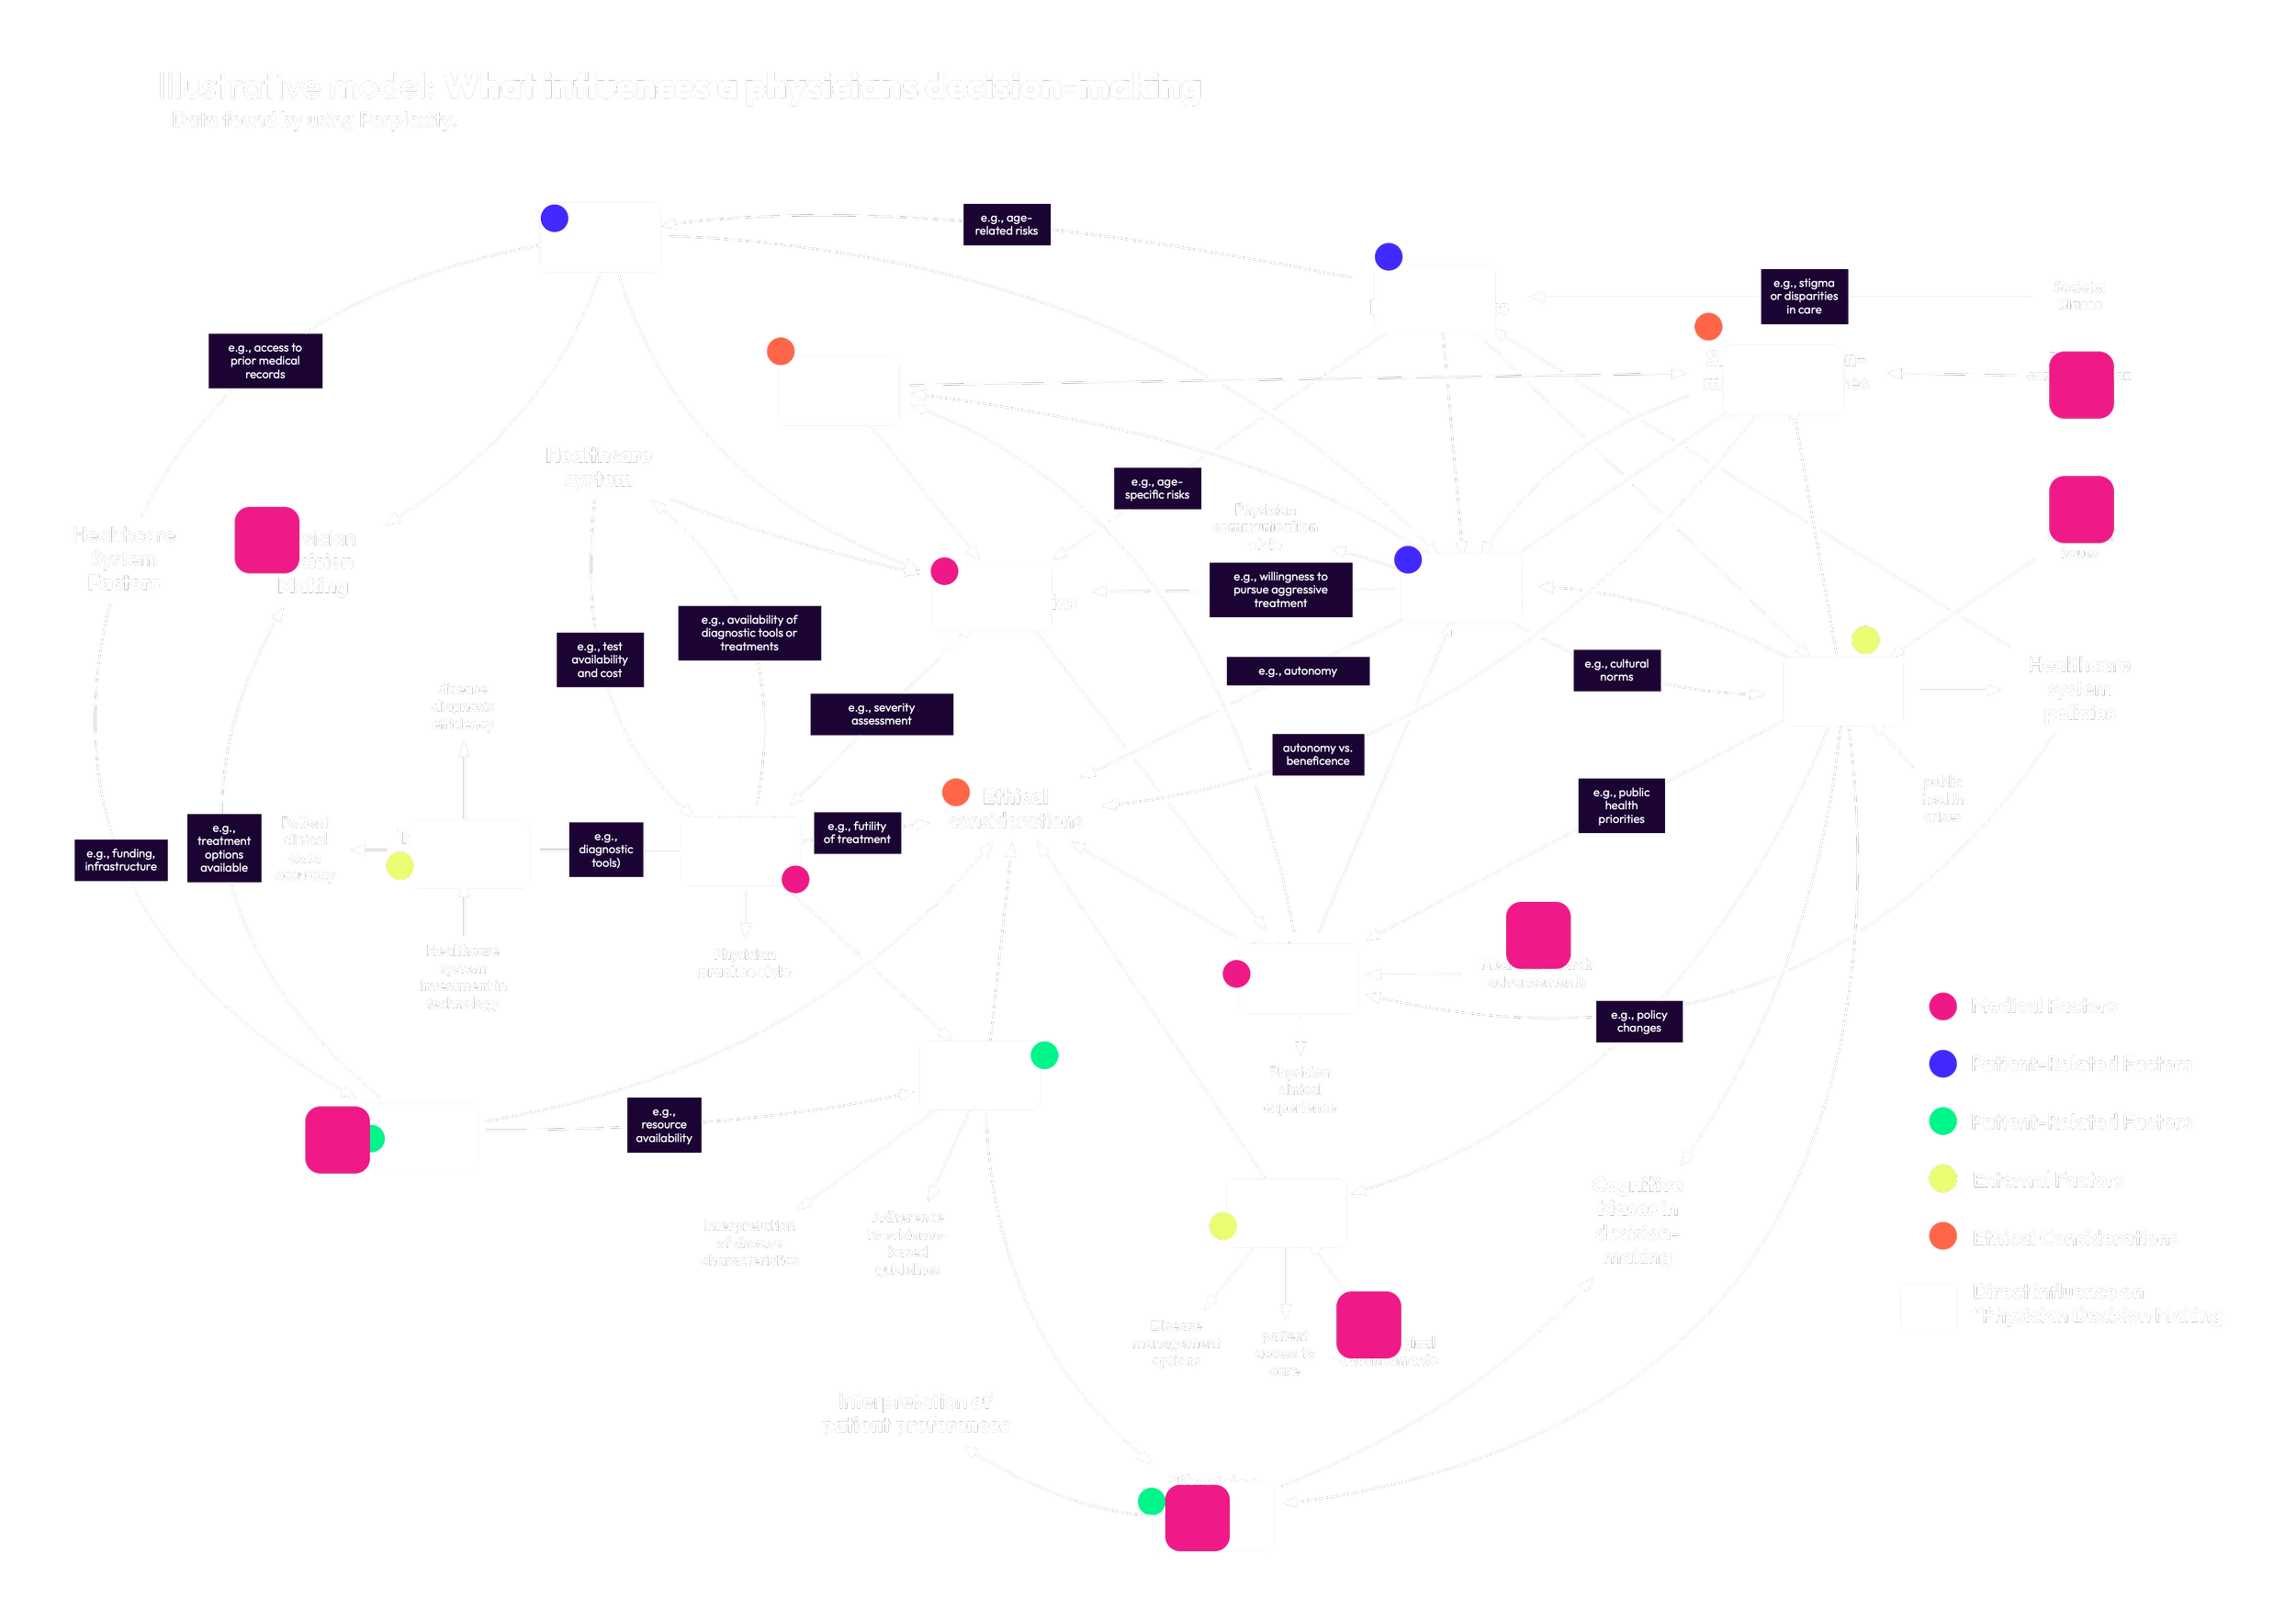
In this model we’ve used Perplexity to identify the most significant influences to a physicians decision making and how these relate to each other.
Co-creating this map helps the cross-functional team develop a shared understanding of what their ecosystem looks like.
Where they can identify own and shared opportunities with other departments and coordinate efforts.
Step 2: Identify strategy, measures and decisions
In the second step the cross-functional team collaborates to find their most important areas where they want to have influence (their strategy).
Then how these strategic areas are influenced, what the influence is and how it can be measured.
Knowing this helps the team identify which decisions it needs to make to amplify or reduce influence and optmimize towards success.
The team identifies where they want to have influence
The pink squares indicate where the team suggests they can have the most effective influence, setting the strategy, measures and most important decisions.
In the third step the team uses the map to identify the data available today.
Step 3: Mapping the current data

The yellow squares indicate what the currently available data can help the team understand. This helps the team understand which of this data is more or less valuable. Reducing investments in the wrong data can reduce waste and fee up resources for the organization.
Step 4: Mapping the needed data

In the fourth step the team uses the map to identify the data needed, by looking at which relationships and influences they have to understand to inform their most important decisions.
The pink squares indicate the strategy and the green squares the data relevant to this strategy. The yellow squares indicate the current data and gives a view of how relevant this data is.
Step 5: Finding the data, making the right investments and reducing waste
With the map the team is able to:
Create a visual, rich and shared understanding of the ecosystem the team wants to influence, informing a shared strategy increasing employee engagement, coordination and collaboration.
The team can now both: identify which data is needed to serve their most important decisions and reduce investments in data that is not relevant or creates unwanted bias.
Increasing their data effectiveness and efficiency.
